N <- 1:100
R <- 1:100
par(pty="s",mfrow=c(1,1),mar=c(4,3.3,1,1))
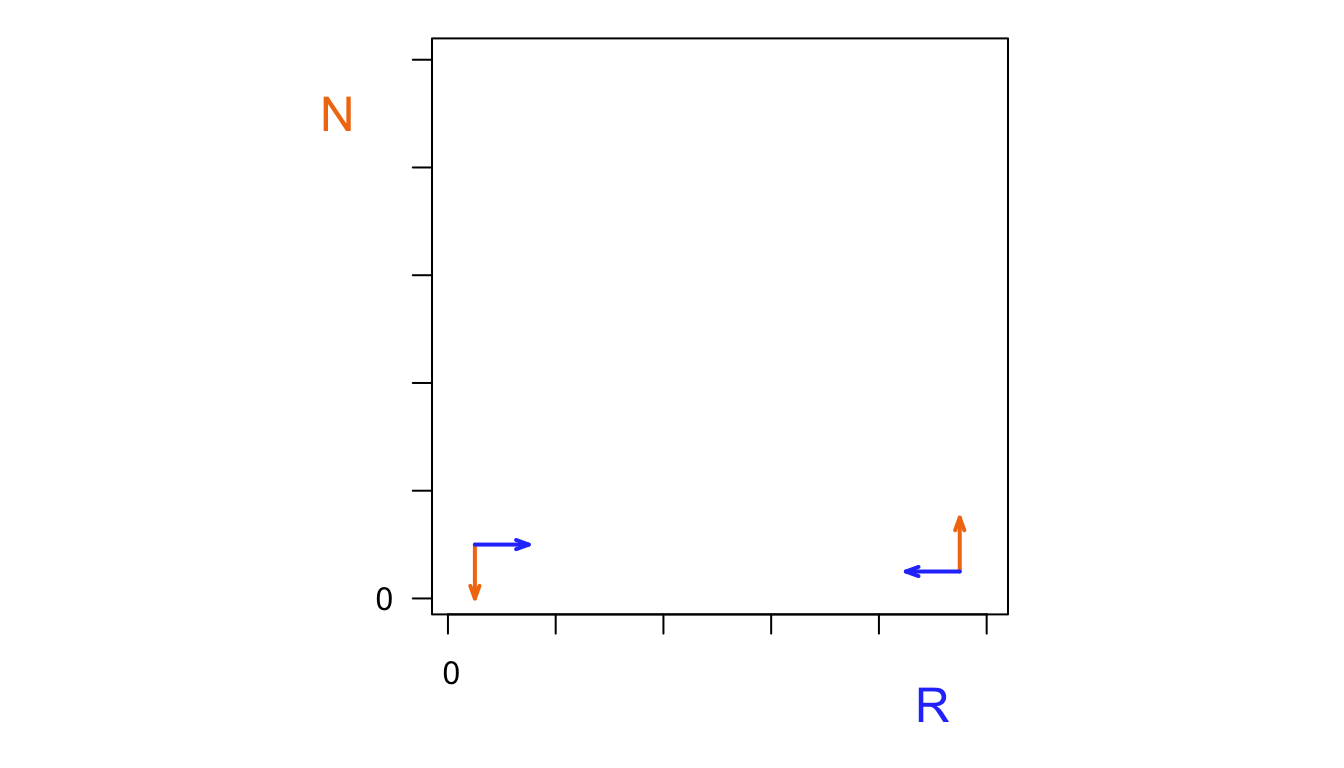
plot(R,N, col.axis="#FF7F50",type='n',xaxt='n',xlab="",ylab="",axes=FALSE, frame.plot=TRUE)
mtext("R", font=2,side=1, line=2, col="#2d43fc", cex=1.5, at=90)
mtext("N", font=2,side=2, line=2, col="#FF7F50", cex=1.5,adj=1,las=2, at=90)
mtext("0", font=2,side=2, line=1, col="black", cex=1,adj=1,las=2, at=0)
mtext("0", font=2,side=1, line=1, col="black", cex=1,adj=0,las=1, at=-1)
Axis(side=1, labels=FALSE)
Axis(side=2, labels=FALSE)
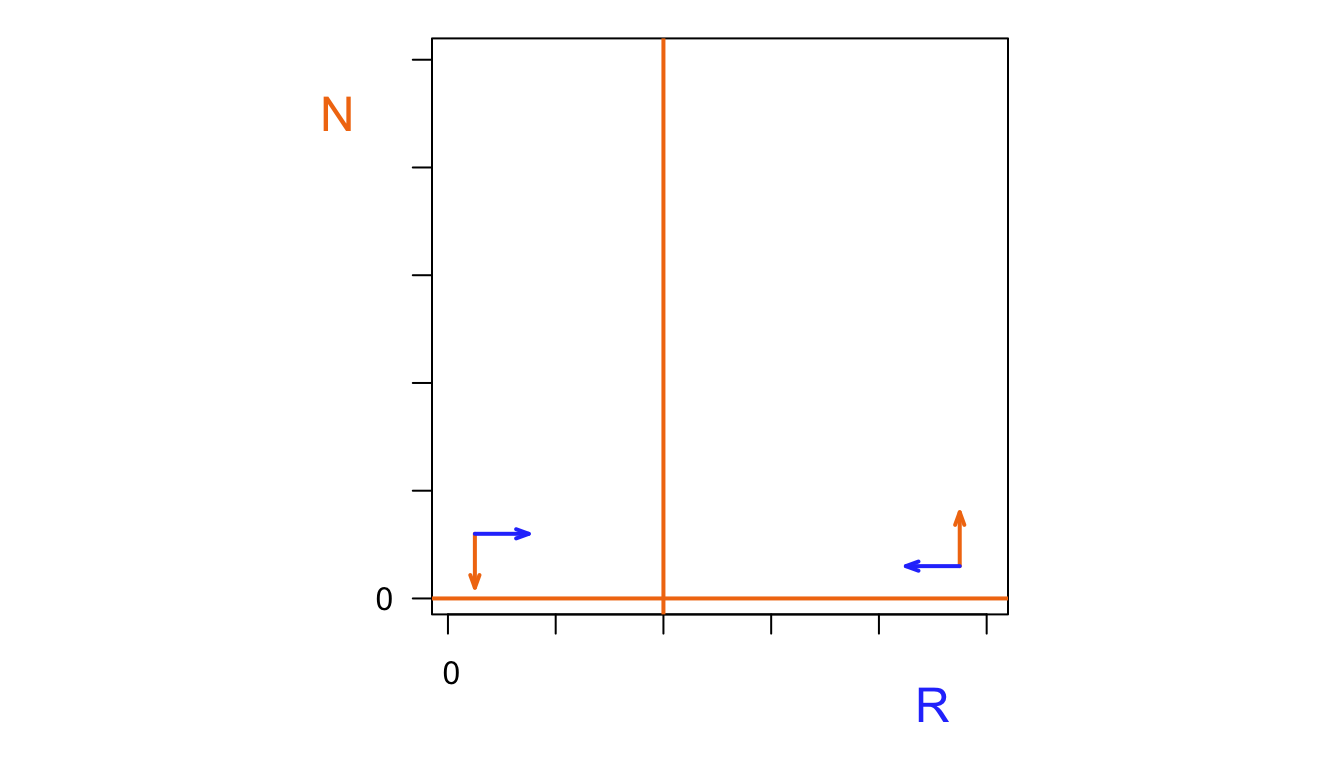
abline(h=0, lwd=3, col="#FF7F50")
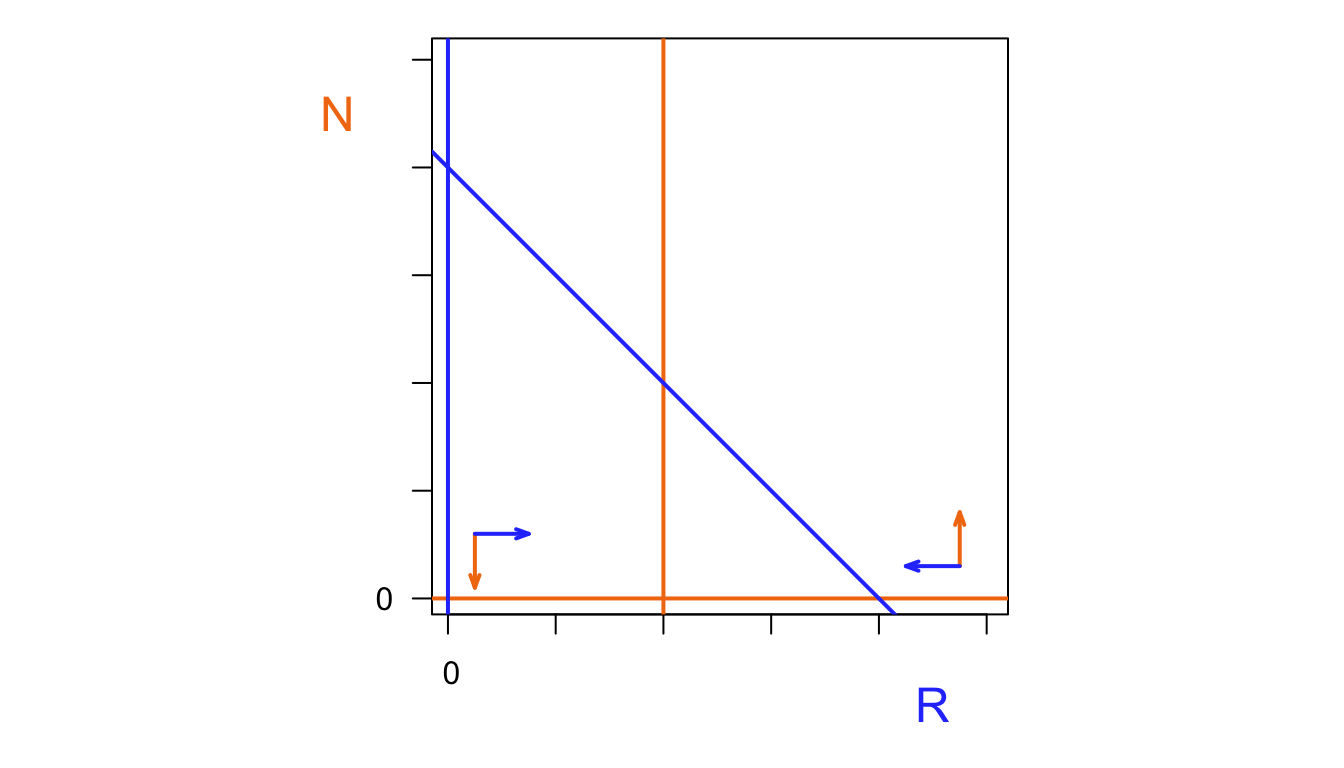
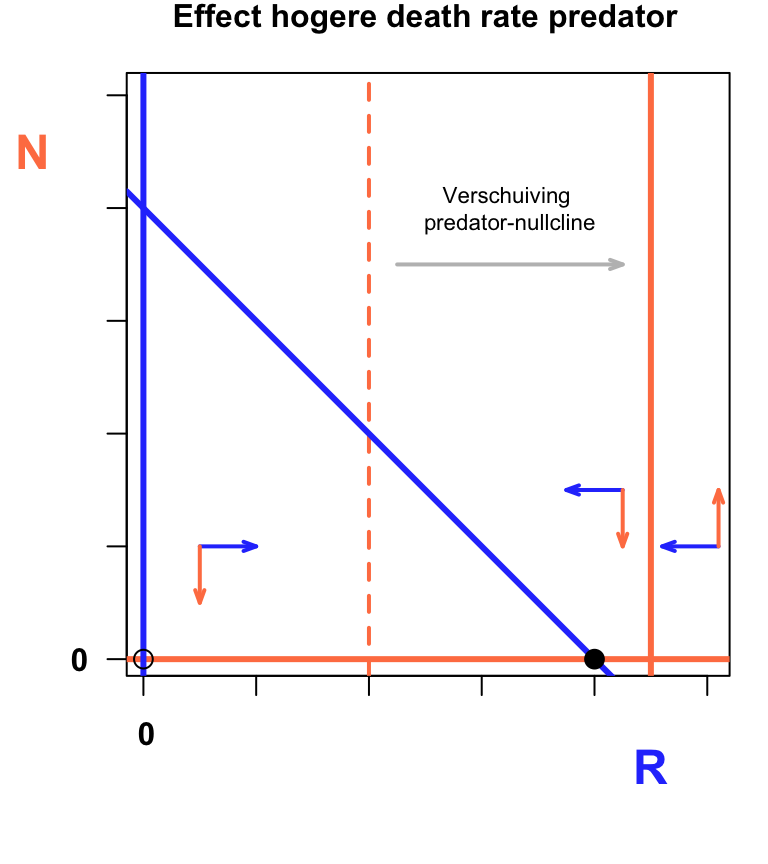
abline(v=40, lwd=2, col="#FF7F50", lty=8)
arrows(45, 70, 85, 70, length = 0.07, angle = 20, col="grey",lwd=2)
text(65,80,"Verschuiving \npredator-nullcline",cex=0.7)
mtext("Effect hogere death rate predator", font=2,side=3, line=1, col="black", cex=1.0, at=50)
abline(v=90, lwd=3, col="#FF7F50")
abline(v=0, lwd=3, col="#2d43fc")
abline(a=80,b=-1, lwd=3,col="#2d43fc")
points(0,0,cex=1.3)
points(80,0,cex=1.3,pch=19)
add_vector <- function(x,y,dx,dy){
arrows(x, y, x+dx, y, length = 0.07, angle = 20, col="#2d43fc",lwd=2)
arrows(x, y, x, y+dy, length = 0.07, angle = 20, col="#FF7F50",lwd=2)
}
add_vector(10,20,10,-10)
add_vector(85,30,-10,-10)
add_vector(102,20,-10,10)
N <- 1:100
R <- 1:100
plot(R,N, col.axis="#FF7F50",type='n',xaxt='n',xlab="",ylab="",axes=FALSE, frame.plot=TRUE)
mtext("R", font=2,side=1, line=2, col="#2d43fc", cex=1.5, at=90)
mtext("N", font=2,side=2, line=2, col="#FF7F50", cex=1.5,adj=1,las=2, at=90)
mtext("0", font=2,side=2, line=1, col="black", cex=1,adj=1,las=2, at=0)
mtext("0", font=2,side=1, line=1, col="black", cex=1,adj=0,las=1, at=-1)
Axis(side=1, labels=FALSE)
Axis(side=2, labels=FALSE)
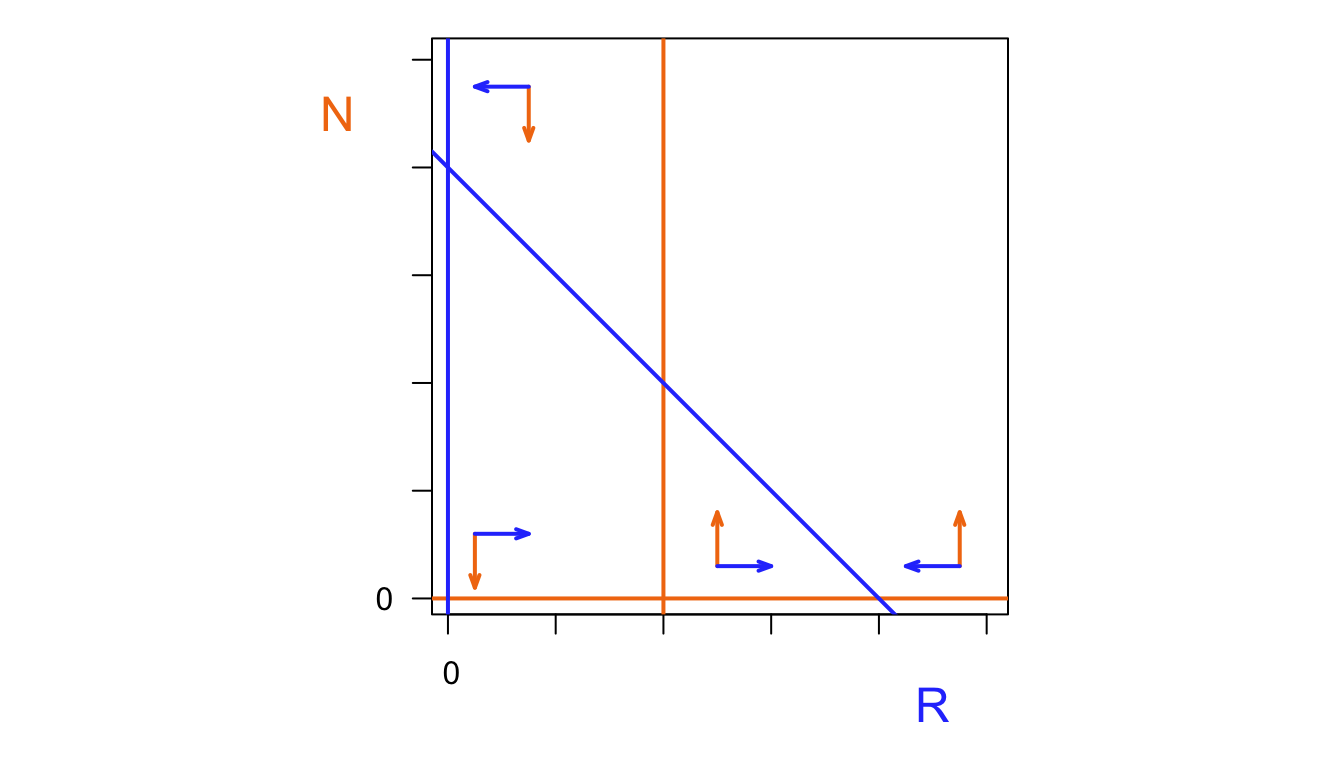
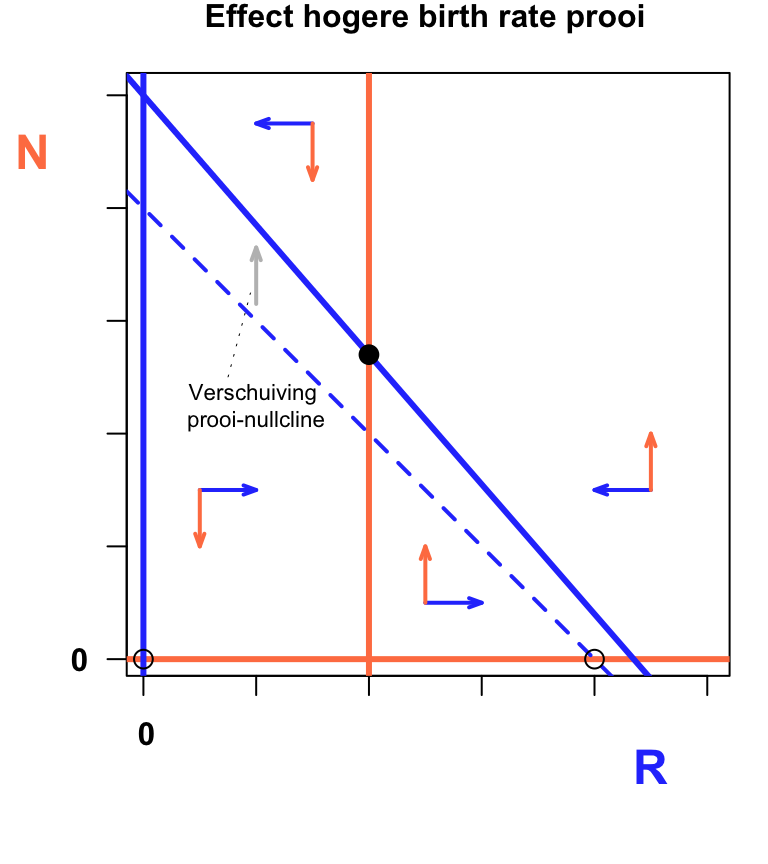
abline(h=0, lwd=3, col="#FF7F50")
abline(v=40, lwd=3, col="#FF7F50")
arrows(20, 63, 20, 73, length = 0.07, angle = 20, col="grey",lwd=2)
text(20,45,"Verschuiving \nprooi-nullcline",cex=0.7)
arrows(15,50,19,65,length=0,lty=3,lwd=0.5)
mtext("Effect hogere birth rate prooi", font=2,side=3, line=1, col="black", cex=1.0, at=50)
abline(v=0, lwd=3, col="#2d43fc",)
abline(a=80,b=-1, lwd=2,lty=8,col="#2d43fc")
abline(a=100,b=-1.15, lwd=3,col="#2d43fc")
points(0,0,cex=1.3)
points(40,54,cex=1.3,pch=19)
points(80,0,cex=1.3)
add_vector <- function(x,y,dx,dy){
arrows(x, y, x+dx, y, length = 0.07, angle = 20, col="#2d43fc",lwd=2)
arrows(x, y, x, y+dy, length = 0.07, angle = 20, col="#FF7F50",lwd=2)
}
add_vector(10,30,10,-10)
add_vector(50,10,10,10)
add_vector(30,95,-10,-10)
add_vector(90,30,-10,10)